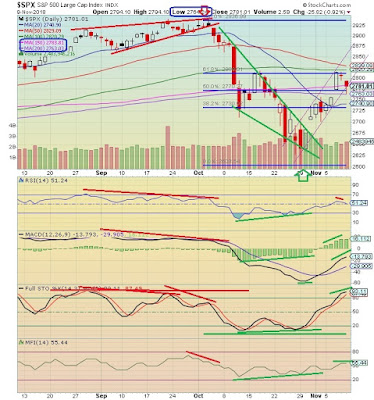
The bulls and bears battle at key moving averages. The SPX drops to the 200-day MA at 2763 on Friday to make a bounce or die decision and booooiiiiiiinnnngg. Price bounces and runs above the 150-day MA at 2783, however, at the end of the session, the SPX slips away to close at 2781 below the 150. Watch this 2783 level closely on Monday. Stocks trade tomorrow but the bond market is closed for Veterans Day observance.
The 200 EMA on the 60-minute chart is 2776 another super important near-term number. Thus, above 2784 the bulls will be throwing confetti, chugging Fed wine as if it was grape juice and buying stocks with both fists. If price cannot move above 2784, then it is going back down to the 200 EMA at 2776 for another kiss and bounce or die decision. If 2776 fails, stocks are in big trouble and price will drop to the 200-day MA at 2763 for a bounce or die decision. Equities will fall apart into mayhem and devastation if the SPX drops below the key 2753-2763 support gauntlet.
The red lines show the neggie d spankdown. The overbot conditions and red rising wedge pattern also create the smack down. Conversely, price falls into the green falling wedge, a bullish pattern, and the RSI and stochastics are oversold wanting a bounce. The green lines show the possie d that launched the SPX off the near-2600 bottom.
The MACD line remains long and strong and would like to see another higher high in price, in this daily time frame, after any weakness occurs for a day or three.
The blue lines show the Fibonacci retracements for the drop from 2937-ish to 2603-ish. The key Fib levels are 38.2%, 50% and 61.8%. You can calculate them yourself by simply taking the distance of the drop, about 334 points, and applying the percentages. For example, the 50% retracement back to the upside after the big selloff is 167 points (334x0.5) and adding that to 2603 is 2770, voila, that is the 50% Fib retracement. Do the same for the other percentages. The 38% Fib is 2731 and the 62% Fib is 2810.
The S&P 500 ran higher to the 61.8% Fib retracement where it hit its head on the ceiling. Then the next day, last Thursday, price hit its head on the ceiling again. It is a tough resistance ceiling for the SPX to get up through. Bulls are tired after the two-day assault and they fall back on Friday to regroup.
Watch the 150-day MA at 2784 that tells you the stock market directional story for Monday. Bulls win above 2784. Bears win below 2784 (but actually need to drop below 2776). Watch the slope of that pink 150-day MA line going forward. It is sloping up so the stock market remains in a cyclical bull market pattern. Bears need that 150-day MA line to flatten and then roll over with a negative slope that will usher in a sustainable cyclical bear market. Until then, the bulls are whistlin' Dixie. This information is for educational and entertainment purposes only. Do not invest based on anything you read or view here. Consult your financial advisor before making any investment decision.
Note Added Tuesday Morning, 11/13/18, Before Opening Bell: Yesterday was carnage. The Dow fell 602 points. Blood is in the streets. The SPX 2776 failed, then the 2763 failed, then the key 2753-2763 support gauntlet gave way and boom; collapse occurs. The SPX drops to 2722 and closes at 2726 where today begins.

No comments:
Post a Comment
Note: Only a member of this blog may post a comment.