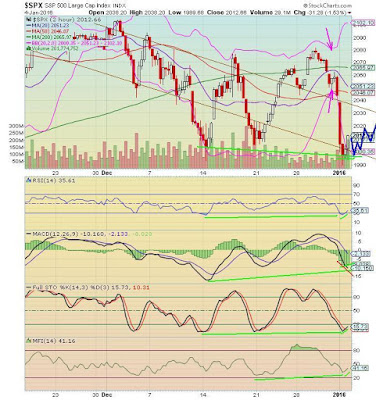
Stocks begin the year puking lower. The S&P 500 loses 31 points, -1.5%, to 2013, the worst opening day in 14 years. The LOD was 1989-1990 so pay attention to this level going forward. S&P futures are -12 a couple hours before the opening bell. The green lines show positive divergence across all indicators except for the weak and bleak MACD line (red line) that wants another price low. At the same time, the MACD line is positively diverged over the last two weeks time frame which is bullish. The RSI and stochastics are oversold looking for a bounce. The indicators are lining up bullishly.
If the weak futures remain in place, the SPX will drop back down to yesterday's lows in the 1990-2000 area but with the possie d and oversold conditions, the dip-buyers may enter in force after the initial dip and then stocks should recover from there to honor the possie d fuel. After the first couple candlesticks print, watch to see if the MACD line turns up with positive divergence which would signal the all-clear for bulls and a relief rally.
Note the tight standard deviation bands (pink arrows) that forecast a huge move. Tight bands do not forecast direction. The band squeeze shot price lower. Since the lower band is violated, a move back to the middle band, now at 2051 and dropping, is on tap. Considering the upper channel line, gap and middle band, a move back to 2035-2050 would be a reasonable expectation. So it looks like stocks should recover after any initial weakness Tuesday morning. As always, a news event can change things in a heartbeat.
The SPX daily chart is hinting at sideways behavior. Ditto the SPX weekly chart although with a downward bias. So stocks may stumble sideways for a few days to get their bearings in this new year of trading. The CPC and CPCE put/call ratios are not yet at panic levels (see previous chart) but perhaps today the put/calls spike strongly higher with an initial market selloff and both analyses would blend together to create the near-term market bottom. This information is for educational and entertainment purposes only. Do not invest based on anything you read or view here. Consult your financial advisor before making any investment decision.
Note Added 7PM EST: The SPX finishes up 4 points to 2017 in very choppy sideways trading today. The rally began but the MACD line did not agree with the bounce since it did not produce positive divergence as described above. Nonetheless, price is moving higher and the middle band at 2043 and dropping is an upside target in play. So both the upside, and the downside, are in play; price may want to come down to 2000-ish to satisfy the MACD. Thus, this may equate to more sideways choppiness. The CPC and CPCE put/calls actually print lower numbers indicating that traders remain complacent and not worried about a market selloff so lower numbers in stocks are likely. Perhaps price wants to drift higher to touch the middle band at 2025-2040 on Wednesday or Thursday, then back down again due to the put/calls. If stocks flush lower tomorrow instead, that may cause the put/calls to spike higher and place the firm near-term bottom for the stock market.

No comments:
Post a Comment
Note: Only a member of this blog may post a comment.