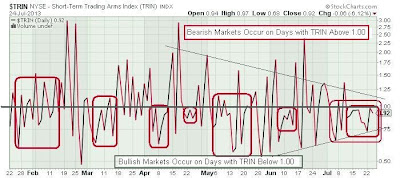
The TRIN is referenced daily and is a vital tool if day-trading. The TICK and TRIN have to be monitored continuously during the day to gauge the ebb and flow of markets. A TRIN above one says the bears rule that day while a TRIN below one says the bulls rule. Uber low TRIN's of 0.7, or 0.6 and lower signal over-the-top bullishness and markets will reverse to the downside to relieve this bullish pressure. Conversely, high TRIN's over 2, 3, 5, and higher signal panic selling occurring and this will identify a bottom. The April and June market bottoms are easy to see on the chart with TRIN's at 3.0 and 2.5, respectively. A TRIN between 1.00 and say 1.60-ish is steady eddy market selling and hints that more selling is likely in the hours or days ahead. Conversely, a TRIN from 0.80 to 1.00 signals steady-eddy buying that may continue.
When many consecutive days occur with low TRIN's, this behavior begs for a market pull back to relieve this euphoric bullishness. The red boxes show the low TRIN behavior which all led to market sell offs. The behavior lately takes the cake since the TRIN has ended the day under one for about nine days in a row and if you include the spike a couple weeks ago, you may as well call it three weeks. This bullish pressure must be relieved. Interestingly, the TRIN is narrowing into a decision point now as shown by the lower highs and higher lows over the last three months. For the six prior red squares, the SPX sold off -45, -20, -60, -35, -90 and -95 handles. This is an average spank down of -58 points with a minimum drop of -20 and maximum drop of -95. The move off the 1698 top over the last day is about -12 SPX points not yet reaching the minimum threshold projection.
Currently the TRIN is like a beach ball held underwater, eventually, whoosh, it explodes up and out with a spike in the TRIN a la April, May and June spikes which correspond to market drops. Projection is for the TRIN to start printing above one in the days and week or two ahead, to relieve the three week of bullish euphoria, which corresponds to the broad indexes selling off. If the average -60 handle drop occurs, that would place the SPX in the 1630's or 1640's when the TRIN would be expected to be at 2 or 3 or higher and identify a market bottom. This is only one tool which must be used in conjunction with all the other ongoing tools on this site. This information is for educational and entertainment purposes only. Do not invest based on anything you read or view here. Consult your financial advisor before making any investment decision.

KS-
ReplyDeleteI know you post the TICK and TRIN values regularly, but for my information, when Keystone retires in a summer home on the Strait of Gibraltar, where can I find real time TRIN and TICK values? Is there a streaming feed on anywhere?
FeS2
You should be able to access them on your broker platform, if not you can send them a message and ask what the symbol is, you can try punching in TICK, TRIN, $TICK, $TRIN, ^TICK, ^TRIN and see if any of those work. If you have a stockcharts subscription, simply use the $TICK and $TRIN and you can watch it on a minute chart. Even without a subscription, you can watch it on stockcharts on a daily basis for free. TICK and TRIN are the two key tools for day trading. TRIN you can tell the bias for the day. When entering or exiting any trade, TICK is very useful to shave off extra pennies. If entering a long trade, or covering a short, wait for a low -1000 TICK, if possible, and grab the trade there, since that will give you some extra pennies. Conversely, if you are selling a long, or entering a short position, try to wait for a +1000 TICK and jump in at that point to get the maximum bang for your buck. Note the TICK low today at -815 at 2:25 PM EST, which, marked the bottom in the SPX. The TICK identifies the intraday tops and bottoms.
DeleteThat's great information! Thanks so much for helping me learn so much!
ReplyDeleteI always try to eyeball the entry and exit points and often leave alot on the table. It sucks.
FeS2