The intermittent Internet outages continue on this blustery day in wintry Pennsylvania. Everyone wanted the SPX to exceed the all-time closing high at 1565.15 for the last three weeks with the refrain, "Just do it already and get it over with." Today the SPX exceeded the 1565.15 at 10:33 AM EST about one-hour after the opening bell. The bulls pushed the SPX above 1564 so punching through the old high was a given. The all-time intraday high is 1576.09. For the higher print today to matter, the SPX needs to close above 1565.15 since this price is, of course, a closing high number. The GTX plays around at the 4931 level today and at noon collapsed. This causes the weakness appearing in the SPX right now. Watch GTX 4931 today and more importantly, volatility. It is a broken record, but VIX 14.65 rules the roost. VIX is at 13-ish well under the 14.65 so the bulls rule. The bears receive their turn when VIX prints above 14.65.
The close may be interesting today with a volume push expected in the final half hour as funds rebalance and reposition for Q2. Volume is very light thus far. The monthly charts receive new data points today. This last week of March is typically bullish as well as the day before the Easter holiday so this seasonality helps the bulls finish the week. GDP missed by a tick at 0.4% and Chicago PMI disappointed as well but markets continue to ignore any bad news since the Fed's punch bowl is stocked with booze and long traders stagger to and fro imbibing while buying the market. Other analysts are beginning to point out the oddity of seeing consumer staples and utilities lead higher, which would actually be expected to occur when a market is topping. The Fed's money is pumping the Dividend Stock Bubble each day and now European money is likely pushing into the same stocks as well. Tech is lagging and it should be leading. Continue watching SOX 422, semiconductors, for clues moving forward.
For today, watch to see if the SPX closes above 1565.15 to print a new all-time closing high, or not. Also watch GTX 4931, VIX 14.65. The final hour of trading may create some excitement. The euro is 1.2823. The euro was well under 1.28 this morning on the weak German employment data but recovered. The 10-year yield is 1.85% flat today. Cyprus bank runs are tame after some initial unrest as the banks open. Cypriots cannot do much except take their 300 euro's each day, check the balance, and go back home. The television reporters and crews likely outnumbered the worried depositors. Cyprus is the minnow and Italy is the big fish. Any news from Italy concerning new elections, or a government, will impact equity markets.
Note Added 3/28/13 at 2:25 PM: Markets march higher despite the collapse in copper today. JJC is down 1.5% but the broad indexes do not care. Commodities in general are lackluster. TRIN is 1.10 continuing to prefer the top side of one today but it has not helped the bears, so far. VIX is at 13. Status quo, a lazy low-volume day into a holiday weekend. The SPX minute and hourly charts are setting up with negative divergence but price keeps moving higher. The HOD is 1568.30; watch to see if the SPX punches up through, or not.
Note Added 3/28/13 at 4:20 PM: The broad indexes ramp higher all afternoon with the SPX gaining five handles in the last hour to close at a new all-time closing high at 1569.19 and new 2013 intraday high at 1570.28. The all-time high in the SPX is 1576.09 not yet achieved. VIX drifted lower to end at 12.71; the low volatility allows the continuous upward market action. Copper finishes weak down -1.5% today and down -2% on the week, but markets do not care about Dr. Copper's illness. Look at SDY and the DVY, both closing at the highs today pumping the Dividend Stock Bubble. Look at utilities, UTIL closes at 508.40, an obscene upside orgy as folks are chasing yield and perceived safety regardless of price. UTIL is up 17% in 19 weeks; utilities are moving up one percent per week, that is astounding. Healthcare is another high flyer. Look at XLV closing at the highs. XLV is up 50% in the last two years, a pace of 25% per year. The Fed's easy money is feeding these new asset bubbles. The bears had the week stacked against them due to all the bullish seasonality factors mentioned last weekend and that was too much for the short sellers to overcome. The focus for the SPX next week will be if a new all-time high at 1576.09 occurs, or not. Cyprus and Italy remain in focus. The decision from Italy concerning new elections, or not, will impact markets come Monday. Event risk must be respected moving forward. The easiest way for the markets to hurt the maximum amount of traders is to experience an event overnight that causes markets to open far lower trapping the long side. Stay alert and aware. The extra day off tomorrow is welcome. For now, an apple pie requires closer study.
Thursday, March 28, 2013


Keystone's Morning Wake-Up 3/28/13; Cyprus Banks Reopen; Italy; GDP; EOM; EOQ1
The Pennsylvania winds are blowing knocking out service intermittently. Winter continues. Markets are flat this morning after dropping on worse than expected Germany unemployment data about one hour ago. Cyprus banks reopen and depositors are only allowed to withdraw 300 euro's (about $390) and check their balances. There is no check-cashing or other regular bank practices. Transactions out of the country are limited as well so there is now an odd scenario occurring where a euro in Cyprus is actually worth less than a euro in the main continent due to liquidity restrictions. Things become stranger by the day. The bank runs appear orderly, mainly middle-aged and older folks that do not have ATM cards since they are the most cash-strapped. Markets in general continue along with a wait-and-see attitude.
Volume is very low the last couple days only running at about 75% of day's average expected volume, today will likely be less since it is the last day of the week, month (EOM) and quarter (EOQ1), and the Easter holiday weekend begins in only about nine hours. Markets are typically buoyant into a holiday weekend. The full moon yesterday morning created the expected market buoyancy this week. The last week is typically up so this seasonality factor remains in play. The SPX keeps teasing the 1565.15 all-time closing high but falls short. For today, the bulls only need one point of upside, to punch through 1564 and the 1565 will give way in quick order with the SPX moving up into the high 1560's. The bears need to push under 1552 to accelerate the downside. A move through 1553-1563 is sideways action. The 8 MA remains above the 34 MA on the SPX 30-minute chart so the bulls remain in control.
Volatility and commodities are important for market direction. Watch VIX 14.65. Watch GTX 4931. Bulls will gather strength if the GTX stays above 4931. Bears will create market weakness if the GTX drops under 4931. Jobless Claims and GDP are released at 8:30 AM. Chicago PMI 9:45 AM. Natty Gas Inventories at 10:30 AM. Kansas City Fed 11 AM. 7-Year Auction 1 PM. MOS and BBRY earnings are of interest. The 10-year yield is 1.85% steady after the large drop yesterday (move higher in bond prices). The euro is at 1.28 recovering from the German shock this morning. Considering the expected low volume, and bullish seasonality in place, the bulls should be able to take out the SPX 1565 all-time closing high today. GDP may offer the only surprise aside from the ongoing drama in Europe with Cyprus and Italy.
Volume is very low the last couple days only running at about 75% of day's average expected volume, today will likely be less since it is the last day of the week, month (EOM) and quarter (EOQ1), and the Easter holiday weekend begins in only about nine hours. Markets are typically buoyant into a holiday weekend. The full moon yesterday morning created the expected market buoyancy this week. The last week is typically up so this seasonality factor remains in play. The SPX keeps teasing the 1565.15 all-time closing high but falls short. For today, the bulls only need one point of upside, to punch through 1564 and the 1565 will give way in quick order with the SPX moving up into the high 1560's. The bears need to push under 1552 to accelerate the downside. A move through 1553-1563 is sideways action. The 8 MA remains above the 34 MA on the SPX 30-minute chart so the bulls remain in control.
Volatility and commodities are important for market direction. Watch VIX 14.65. Watch GTX 4931. Bulls will gather strength if the GTX stays above 4931. Bears will create market weakness if the GTX drops under 4931. Jobless Claims and GDP are released at 8:30 AM. Chicago PMI 9:45 AM. Natty Gas Inventories at 10:30 AM. Kansas City Fed 11 AM. 7-Year Auction 1 PM. MOS and BBRY earnings are of interest. The 10-year yield is 1.85% steady after the large drop yesterday (move higher in bond prices). The euro is at 1.28 recovering from the German shock this morning. Considering the expected low volume, and bullish seasonality in place, the bulls should be able to take out the SPX 1565 all-time closing high today. GDP may offer the only surprise aside from the ongoing drama in Europe with Cyprus and Italy.
Wednesday, March 27, 2013
Keystone's Midday Market Action 3/27/13; Cyprus; Italy
Markets drop after the opening bell but the VIX could not even punch above 14 let alone move towards 14.70, hence the selling faded and allows a bullish come back. The VIX is now under 13 providing bull fuel. The TRIN spiked to 2.55 at the market lows today but is now at 1.19, and even making it back to the 1.00 neutral line taking the wind out of the bear sails. The SPX is at 1560. The 8 MA remains above the 34 MA on the 30-minute chart signaling bullish markets ahead so the bulls have no worries.
The turmoil in Europe appears serious. The banks are sold off, however, the U.S. equity markets only want to move higher. The Cyprus banks reopen tomorrow so the extent of the bank runs can be gauged. Italy is a mess and appears that new elections may be required. Bersani says you must be 'insane' to run Italy and Monti can hardly wait to leave. The negative commentary by Euro leaders are hurting the Eurozone.
The turmoil in Europe appears serious. The banks are sold off, however, the U.S. equity markets only want to move higher. The Cyprus banks reopen tomorrow so the extent of the bank runs can be gauged. Italy is a mess and appears that new elections may be required. Bersani says you must be 'insane' to run Italy and Monti can hardly wait to leave. The negative commentary by Euro leaders are hurting the Eurozone.
Keystone's Morning Wake-Up 3/27/13; Cyprus; Italy
Wild moves in the note and bond markets this morning. The troubled European nations such as Greece, Portugal, Spain and Italy all show rising yields, Spain is now over 5% and Greece over 12%. Conversely, money is seeking the safer haven countries with the greatest portion going to Germany, U.K. and the U.S. Germany 10-year yield dropped to 1.29% this morning. The U.S. 10-year Treasury dropped to 1.85% now at 1.86%, a big move from yesterday. The Cyprus bank capital controls may last for years. That is a good news bad news scenario; ....the good new is that your money is safe and you can withdrawal it. Whew, that was a close one. The bad news is that you are only allowed to withdrawal one hundred bucks per day so by 2015 you will be able to get your money back.
President Obama signs the Continuing Resolution (CR) as expected so the goverment does not have to worry about a shutdown until September. However, the Debt Ceiling Limit is now drawing closer again; that can was kicked to May, now only one month away. There are two days remaining in the month and quarter. Trader's may be in a selling mood since the quarter was record-setting for bulls. The full moon occurred a couple hours ago helping yesterday's bullishness. Markets are typically bullish going into a holiday weekend but the S&P futures are down seven right now with the falling yields. The euro fell through 1.28 a couple hours ago.
The Italy drama is returning to the front stage again. Bersani says a government may not be formed and new elections would be required. He also says you must be 'insane' to run Italy. These comments started rolling the ball down hill about two or three hours ago. The markets were flat to slightly positive until this news. Italy is a major too-big-to-fail nation so going without a government for a couple more months, as their debt hits records day after day, is not good news. The Mortgage Applications are up so that produces five down weeks out of the last seven. Fed heads are out in force today speaking. Oil Inventories are at 10:30 AM. Crude oil drops back under 96. Several earnings reports are of interest today; FIVE and PVH will affect the retail sector, PAYX indicates payrolls and UNF is a uniform indicator.
Volatility remains key. The bulls are on easy street with the VIX well under 14.70. Bears cannot cause damage until VIX 14.70 occurs. SOX 422 is another bull-bear line with bulls handily above. The commodities, GTX, are important and may provide some additional bull strength if GTX moves higher. For the SPX today, starting at 1564, one point away from the all-time closing high at 1565.15 (the all-time intraday high is 1576.09), the bulls simply needed any hint of green futures to propel markets higher, however, the S&P futures are now down -8. The bears need to push under 1552 to accelerate the downside. A move through 1553-1563 is sideways action today. The 8 MA is above the 34 MA on the SPX 30-minute chart signaling bullish markets for the hours and days ahead so watch for a potential bearish cross on this indicator this morning. The importance of VIX 14.70 cannot be understated. Even if the broad indexes would plummet lower after the open, if the VIX does not go above 14.70, the bears got nothing.
President Obama signs the Continuing Resolution (CR) as expected so the goverment does not have to worry about a shutdown until September. However, the Debt Ceiling Limit is now drawing closer again; that can was kicked to May, now only one month away. There are two days remaining in the month and quarter. Trader's may be in a selling mood since the quarter was record-setting for bulls. The full moon occurred a couple hours ago helping yesterday's bullishness. Markets are typically bullish going into a holiday weekend but the S&P futures are down seven right now with the falling yields. The euro fell through 1.28 a couple hours ago.
The Italy drama is returning to the front stage again. Bersani says a government may not be formed and new elections would be required. He also says you must be 'insane' to run Italy. These comments started rolling the ball down hill about two or three hours ago. The markets were flat to slightly positive until this news. Italy is a major too-big-to-fail nation so going without a government for a couple more months, as their debt hits records day after day, is not good news. The Mortgage Applications are up so that produces five down weeks out of the last seven. Fed heads are out in force today speaking. Oil Inventories are at 10:30 AM. Crude oil drops back under 96. Several earnings reports are of interest today; FIVE and PVH will affect the retail sector, PAYX indicates payrolls and UNF is a uniform indicator.
Volatility remains key. The bulls are on easy street with the VIX well under 14.70. Bears cannot cause damage until VIX 14.70 occurs. SOX 422 is another bull-bear line with bulls handily above. The commodities, GTX, are important and may provide some additional bull strength if GTX moves higher. For the SPX today, starting at 1564, one point away from the all-time closing high at 1565.15 (the all-time intraday high is 1576.09), the bulls simply needed any hint of green futures to propel markets higher, however, the S&P futures are now down -8. The bears need to push under 1552 to accelerate the downside. A move through 1553-1563 is sideways action today. The 8 MA is above the 34 MA on the SPX 30-minute chart signaling bullish markets for the hours and days ahead so watch for a potential bearish cross on this indicator this morning. The importance of VIX 14.70 cannot be understated. Even if the broad indexes would plummet lower after the open, if the VIX does not go above 14.70, the bears got nothing.
European Bond Yield Summary 3/27/13
Big changes over the last 24 hours. Greece has blown up through 12% again jumping 62 basis points over the last day, over one-half percent, to print 12.49%. Portugal is above 6% and running higher, up 13 basis points over the last day to 6.24%. Spain is back over the psychological 5% level. Italy may need new elections; the yield jumps 14 bips overnight to 4.68%. If Italy moves above 5%, Europe will become more tense.
10-Year Yields:
Greece 12.49%
Portugal 6.24%
Spain 5.02%
Italy 4.68%
France 2.02%
U.S. 1.88%
Netherlands 1.77%
U.K. 1.74%
Austria 1.67%
Finland 1.54%
Germany 1.30%
Japan 0.52% (record-setting lows)
The safer haven nations all see drops in their yields over the last 24 hours as money seeks perceived safety. Germany dropped 5 bips overnight to 1.30% and briefly dropped down to 1.29% a few minutes ago. The U.K. yield drops to 1.74% from 1.82% yesterday. Money is seeking all the safer haven nations with Germany and the U.K receiving a larger portion. The U.S. 10-year Treasury dropped through 1.90% about an hour ago, now at 1.88% as money seeks safety on this side of the pond as well. Big changes are occurring, watch the four troubled nations at the top of the list moving forward.
Note Added 3/27/13 at 6:26 AM: Big flight to safety occurring. The U.S. 10-year dropping like a stone now at 1.86%. The euro falls through 1.28. S&P futures -5 dropping in concert with the falling yields.
10-Year Yields:
Greece 12.49%
Portugal 6.24%
Spain 5.02%
Italy 4.68%
France 2.02%
U.S. 1.88%
Netherlands 1.77%
U.K. 1.74%
Austria 1.67%
Finland 1.54%
Germany 1.30%
Japan 0.52% (record-setting lows)
The safer haven nations all see drops in their yields over the last 24 hours as money seeks perceived safety. Germany dropped 5 bips overnight to 1.30% and briefly dropped down to 1.29% a few minutes ago. The U.K. yield drops to 1.74% from 1.82% yesterday. Money is seeking all the safer haven nations with Germany and the U.K receiving a larger portion. The U.S. 10-year Treasury dropped through 1.90% about an hour ago, now at 1.88% as money seeks safety on this side of the pond as well. Big changes are occurring, watch the four troubled nations at the top of the list moving forward.
Note Added 3/27/13 at 6:26 AM: Big flight to safety occurring. The U.S. 10-year dropping like a stone now at 1.86%. The euro falls through 1.28. S&P futures -5 dropping in concert with the falling yields.
Tuesday, March 26, 2013
SPX Daily Chart Negative Divergence

The small rectangles show the distribution taking place over the last six weeks. Each higher print in price is followed by a sell day of higher volume. This is the smart money distributing to Joe and Jane Sucka, who are now caught up in the daily bullish media hype. The little guy is jumping all-in long right now for fear of missing out on the upside orgy. But, Joe and Jane are the bagholders, every top needs them. It is nice of them to always show up to be fleeced. If the 1565 is taken out an upside orgy will occur into the blue circle and price will seek out the top rail of the channel. If the chart has its way, price will simply start lower at any time. If the bounce occurs tomorrow, the purple negative divergence will likely remain, so that will only delay the roll over by a couple days. Projection is down at any time. This information is for educational and entertainment purposes only. Do not invest based on anything you read or view here. Consult your financial advisor before making any investment decision.
SPX Weekly Chart Rising Wedge Overbot Negative Divergence

As far as the chart goes, on a weekly basis, the SPX wants to roll over now and moving forward. This information is for educational and entertainment purposes only. Do not invest based on anything you read or view here. Consult your financial advisor before making any investment decision.
SDY Dividend Index Weekly Chart Traders Chasing Yield Dividend Stock Bubble
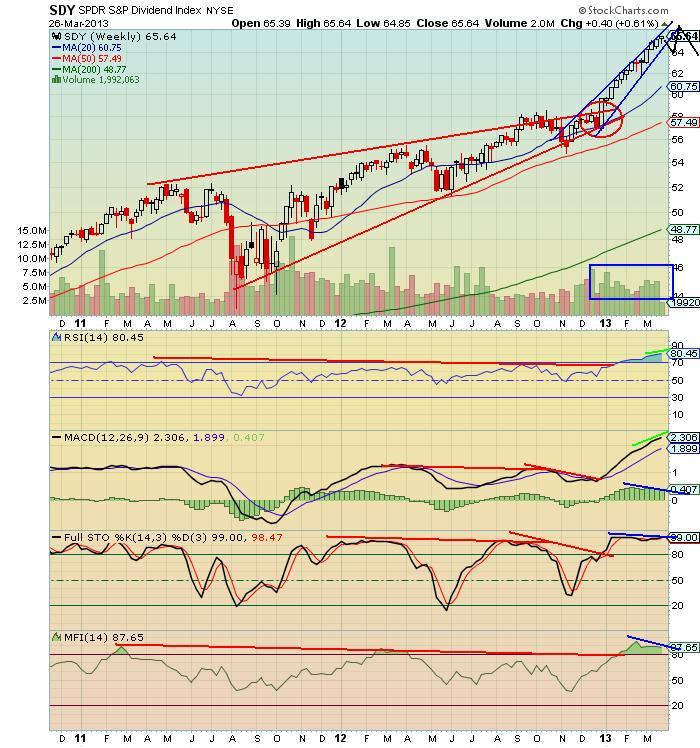
The red lines show the rising wedge, overbot conditions and negative divergence, textbook TA pointing to a serious collapse, then, instead, the fiscal cliff resolution occurs to stop the failure. Bulls were given a huge gift to start the year. The pumping is reaching a feverish pitch now and the charts are prone to topping and rolling over. It will be interesting to see what all these folks do, that chased divvy stocks with hot money, once the dividend stocks start to sell off. This information is for educational and entertainment purposes only. Do not invest based on anything you read or view here. Consult your financial advisor before making any investment decision.
UTIL Utilities Daily Chart Upward-Sloping Channels Overbot Negative Divergence Traders Chasing Yield

That is the funny thing. Each trader thinks he, or she, is smarter than the other with all of them throwing money into dividend and safety plays, such as utilities, using a Ron Popiel, 'set it and forget it' mentality. Investors may not be happy as the weeks play out. Price is near the top BB at 502 so a move up to the 505-ish can not be ruled out, especially if the SPX hits 1565+ tomorrow. The red lines clearly show the negative divergence in place so a spank down is on tap. The weekly chart is topping as well but this type of momo may need another two or three weeks to roll over. The daily chart needs a smack down right now but price will likely recover after a pullback until the weekly chart gives the firm negative divergence signal. UTIL should roll over as April plays out.
Traders are chasing yield and perceived safety now. They are taking the Fed's money and pumping these new asset bubbles thinking there is no worry, since, after all, consumer staples, divvy stocks, all that stuff is always safe, right? The green oval's show how the slightest pull back is bot aggressively. The action in utilities and other dividend and perceived safety plays will be interesting to watch moving forward. This information is for educational and entertainment purposes only. Do not invest based on anything you read or view here. Consult your financial advisor before making any investment decision.
CPC Put/Call Ratio Daily Chart Signals Significant Market Top

The last three weeks is a big tease. The SPX is moving sideways and the CPC stays in the 0.7's. This will resolve with a wildly higher move to 1.20+ that will strike fear into all traders and it is likely coming very soon. The multiple low prints now are like a coiled spring that will want to jump higher. Can the CPC drop lower? Of course it can, especially if the SPX takes out the all-time closing high at 1565 tomorrow, that will likely create final euphoria for a blow-off frothy top, the CPC will likely spike lower perhaps under 0.7 indicating total lack of any fear that markets will ever sell off again. But with the current set-up, it would not be surprising to see a strong spike up in CPC, and corresponding strong down move in the broad indexes, at any time. Tomorrow and the next several days are key. What an interesting time with the Easter holiday upon us. The markets could find a way to idle out sideways to finish the shortened week, and then pick things up on Monday, however, things are very ripe right now for a market pull back. A catalyst is likely all that is needed.
The blue arrows show the selloffs over the last five months. Note how the 8 MA moves above the 21 MA each time to signal the all systems go for launch time. Well, do you think the 8/21 MA cross will occur in the days ahead, perhaps as early as tomorrow, and launch the CPC higher to begin a strong market move lower? That is the projection, a market sell off at anytime, traders are far too relaxed and fearless. Stocks and indexes are not attractive on the long side until the 1.20+ prints. This information is for educational and entertainment purposes only. Do not invest based on anything you read or view here. Consult your financial advisor before making any investment decision.
Subscribe to:
Posts (Atom)