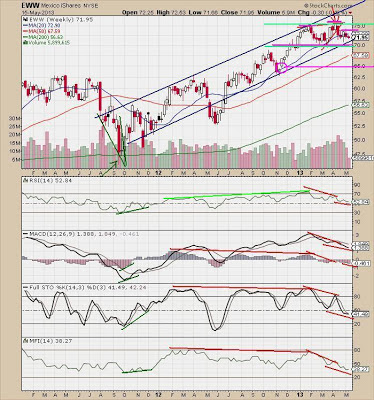
EWW is a one and one-half year darling for long traders. Price is now moving towards a test of the lower rail of the upward-sloping channel at 71. The RSI was long and strong into early this year but rolled over along with all other indicators, and price received the negative divergence smack down. The indicators are weak and bleak showing lower lows in price preferred moving forward. Watch to see if the RSI loses the 50% level, or not. The pink H&S shows a head at 75-ish, neck at 70-ish which would target 65 if the 70 level is lost. The green lines show an ongoing sideways range through 70-75.
Projection is sideways to sideways lower prices moving forward. The 70-71 level will likely serve as near-term support and considering that traders will remain bullish on Mexico for a while longer, price will prefer more sideways ahead. If the RSI loses 50% then the test of the 70 price is a given, and if 70 fails, 65 will follow (note the gap fill needed at 65). Thus, sideways with a downward bias moving forward. The smart money made their money in Mexico. Time for a siesta. This information is for educational and entertainment purposes only. Do not invest based on anything you read or view here. Consult your financial advisor before making any investment decision.

No comments:
Post a Comment
Note: Only a member of this blog may post a comment.