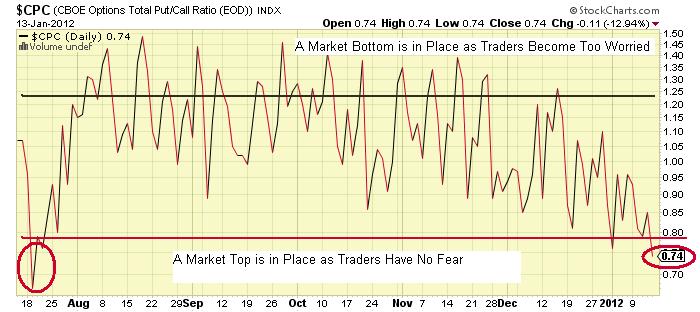
Tonight's print is on the opposite end. When the CPC drops lower and prints in the 0.70's or lower, that shows the traders to be complacent, the wine is flowing like water, there is no fear, there is no worry, happy days are truly here again. The bulls pile into a higher number of calls forcing the ratio to drop ever lower. Then, as the contrarian vibe kicks in, right when traders are all convinced that markets have no where to go but up, just like now with all the bullish media talk, the markets kick in to the downside. Hang on, this chart says the broad markets have a wild downhill ride ahead and it should begin at anytime. Best to prepare yourself. This information is for educational and entertainment purposes only. Do not invest based on anything you read or view here. Consult your financial advisor before making any investment decision.
No comments:
Post a Comment
Note: Only a member of this blog may post a comment.